

Start by organizing your content performance metrics into four tiers: consumption, engagement, conversion, and revenue/authority. Prioritize four numbers above all others: engaged sessions, content-attributed leads, content-attributed revenue, and AI citation share. None of this works without a UTM taxonomy, GA4 event tracking, and a CRM connection feeding the data back into one place.
Table of Contents
- What Are Content Performance Metrics, and Why the Old Scorecard Fails
- Tier 1: Consumption Metrics and What They Actually Tell You
- Tier 2: Engagement Metrics That Predict Whether Content Converts
- Tier 3 and 4: Connecting Content to Pipeline, Revenue, and AI Visibility
- Building the Attribution Stack and Executive Dashboard
- A Four-Step Sprint to Your First Content ROI Report
- How Executive Edge Approaches Measurement for Real Businesses
- What Most Teams Get Backwards About Measurement
- Get a Dashboard Built for You, Not Assembled Piece by Piece
- Sources
- FAQ
What Are Content Performance Metrics, and Why the Old Scorecard Fails
Content performance metrics are the measurements that show whether your content actually moves the business forward, not just whether people looked at it. Most marketing teams still report pageviews and time on page because those numbers are easy to pull, not because they mean anything to the people signing off on budget.
The fix is a four-tier structure that climbs from raw activity to business impact. Tier 1 is consumption (who showed up), Tier 2 is engagement (who stuck around and interacted), Tier 3 is conversion (who became a lead), and Tier 4 is revenue and authority (who became a customer, and whether AI platforms now cite you as a source). Each tier answers a different stakeholder's question. Your content team wants Tier 1 to know what to write next. Your CMO wants Tier 3 to defend the content budget. Your CFO only cares about Tier 4.

This matters because 63% of B2B marketing leaders struggle to attribute revenue to a specific content asset, and only 19% say they have a reliable revenue attribution model. That gap is exactly why so many content programs get cut when budgets tighten: nobody in the room can prove the connection between the blog and the bank account.
Maturity dictates what you report and when. At three months, you're still validating that content gets found and read, so Tier 1 and Tier 2 numbers dominate the conversation. By six months, you should have enough volume to talk about content-attributed leads and form fills. By 12 to 18 months, the report that matters is the one that ties specific articles or campaigns to closed-won revenue and shows content shifting from a cost center to a growth engine in the eyes of leadership. Trying to report Tier 4 numbers in month two just produces noise. Skipping past Tier 1 in year two means you're still flying blind on what actually works.
Tier 1: Consumption Metrics and What They Actually Tell You
Consumption metrics measure whether anyone shows up in the first place. They're the easiest numbers to pull and the easiest to misread as success.
The core set includes organic sessions, pageviews, Google Search Console impressions, and engaged sessions. Of these, engaged sessions deserve the most attention, because raw pageviews count a bot, a bounce, and a genuine reader identically. GA4 defines an engaged session as one lasting 10 seconds or longer, containing a conversion event, or including at least two pageviews, but that default threshold is too loose for long-form content. A better approach ties engagement to scroll depth or a meaningful next action, since engaged sessions defined this way correlate far more closely with downstream conversion than raw time on page.
To instrument this properly:
- Set up a scroll-tracking trigger in Google Tag Manager firing at 75% depth, then push it to GA4 as a custom event.
- Track Search Console impressions alongside clicks to catch content earning visibility but not yet earning clicks (a fixable title-tag or meta-description problem).
- Segment sessions by traffic source before drawing conclusions. Organic and paid audiences behave differently on the same page.
- Watch for a widening gap between impressions and engaged sessions. That gap usually means the content ranks but doesn't deliver what the searcher expected.
Return visitor rate above 30% is a solid signal that you've built an actual audience rather than a series of one-off visits, and engaged time over roughly two minutes tends to correlate with higher-quality reads worth acting on.
Pro Tip: Don't wait for a quarterly report to catch a consumption problem. If a page's impressions climb for two straight weeks while engaged sessions stay flat, that's your cue to rewrite the headline or intro before the algorithm buries it for good.
Tier 2: Engagement Metrics That Predict Whether Content Converts
Engagement metrics are the bridge between "someone read this" and "someone did something about it." This tier is where you find out which content is actually doing sales' job for them, quietly, before a lead ever fills out a form.
The metrics that matter here: click-through rate from search results, return visitor rate, mid-content CTA clicks, resource downloads, and the split between active time-on-task and passive scrolling. CTR from Search Console tells you whether your title and meta description are earning the click your ranking deserves. A page ranking third for a valuable term but pulling a 2% CTR usually has a headline problem, not a ranking problem.
Mid-content CTA clicks deserve more attention than most teams give them. A reader who clicks a "talk to an expert" link buried in paragraph six is a warmer lead than one who scrolls past a footer form without noticing it. Setting this up in Google Tag Manager takes about twenty minutes: create a trigger on the CTA's CSS class or ID, fire a GA4 event named something like cta_click_midcontent, and pass the page URL and CTA label as event parameters so you can tell which specific link is pulling weight.
Practical instrumentation checklist:
- Build a GA4 event for every downloadable asset (
file_download) and tag it with the content topic, not just the filename. - Create a custom GA4 event for mid-content link clicks separate from nav or footer clicks.
- Report return visitor rate by content cluster, not just site-wide, to find which topics build a real following.
- Build an engagement funnel in GA4 Explorations: sessions → engaged sessions → CTA click → form start. Wherever the drop-off is steepest is where you optimize first.
Pro Tip: A page with strong traffic and a weak mid-content CTA click rate is often the highest-leverage edit on your entire site. You're not writing new content. You're moving one link higher and rewriting six words of anchor text.
Tier 3 and 4: Connecting Content to Pipeline, Revenue, and AI Visibility
This is where content earns its budget. Content-attributed leads, form fill conversion rate, and demo requests are the Tier 3 metrics that turn a marketing report into a business case, and they run on the same instrumentation you already built: UTM parameters passed into hidden form fields that sync to your CRM on submission.
Attribution modeling is where most teams overthink the starting point. Start with first-touch attribution because it takes a few hours to configure and gives you a directionally correct answer fast. As lead volume grows, move to position-based or multi-touch models that credit the research-phase blog post and the bottom-funnel case study differently instead of handing all the credit to whichever touch happened first or last.
Revenue attribution follows the same logic, scaled up. If a content-attributed lead has a 12% close rate and an average deal size of $8,000, ten leads from a single pillar article are worth roughly $9,600 in expected pipeline value, a number you can defend in a budget meeting far more easily than "the article got 4,000 pageviews."
Tier 4 also includes a newer category that most dashboards still ignore entirely:
- AI citation share: how often your content gets referenced or quoted inside ChatGPT, Perplexity, or Google's AI Overviews for your target queries.
- AI Overview appearance rate: the percentage of your tracked keywords where an AI Overview shows up and whether your domain is cited in it.
- Branded search lift: the month-over-month change in searches for your company name, a strong proxy for authority building that doesn't show up in a click report.
These matter because AI Overviews are measurably reducing click-through rates on traditional search results, which means a page can lose clicks while still generating real business value through citation alone. Teams that start tracking this now are working a measurement gap almost nobody else has filled yet. For local and service-based businesses specifically, branded-search lift and citation share often predict customer discovery better than a traffic graph ever did, because prospects who search your name after seeing you cited by an AI assistant are already halfway sold.
Building the Attribution Stack and Executive Dashboard
None of the four tiers hold together without a governance layer underneath them, and that layer starts with a UTM taxonomy everyone on the team actually follows.
1. Standardize your UTM structure. Use a fixed pattern: utm_source (channel), utm_medium (content type: blog, video, podcast), utm_campaign (the specific initiative), and utm_content (the individual asset or CTA variant). Keep the UTM spreadsheet as the single source of truth so two people don't tag the same campaign two different ways.
2. Map GA4 events to CRM fields. Every content-attributed form fill should pass its UTM parameters as hidden fields into your CRM record, alongside the first-touch page and the attribution window you're using to credit that touch. A 90-day window is a reasonable default for most B2B sales cycles; shorten it for transactional purchases, lengthen it for enterprise deals.
3. For offline or phone-based conversions, connect offline conversion tracking back into the same CRM record so a lead who calls after reading a guide doesn't disappear from your attribution data entirely.
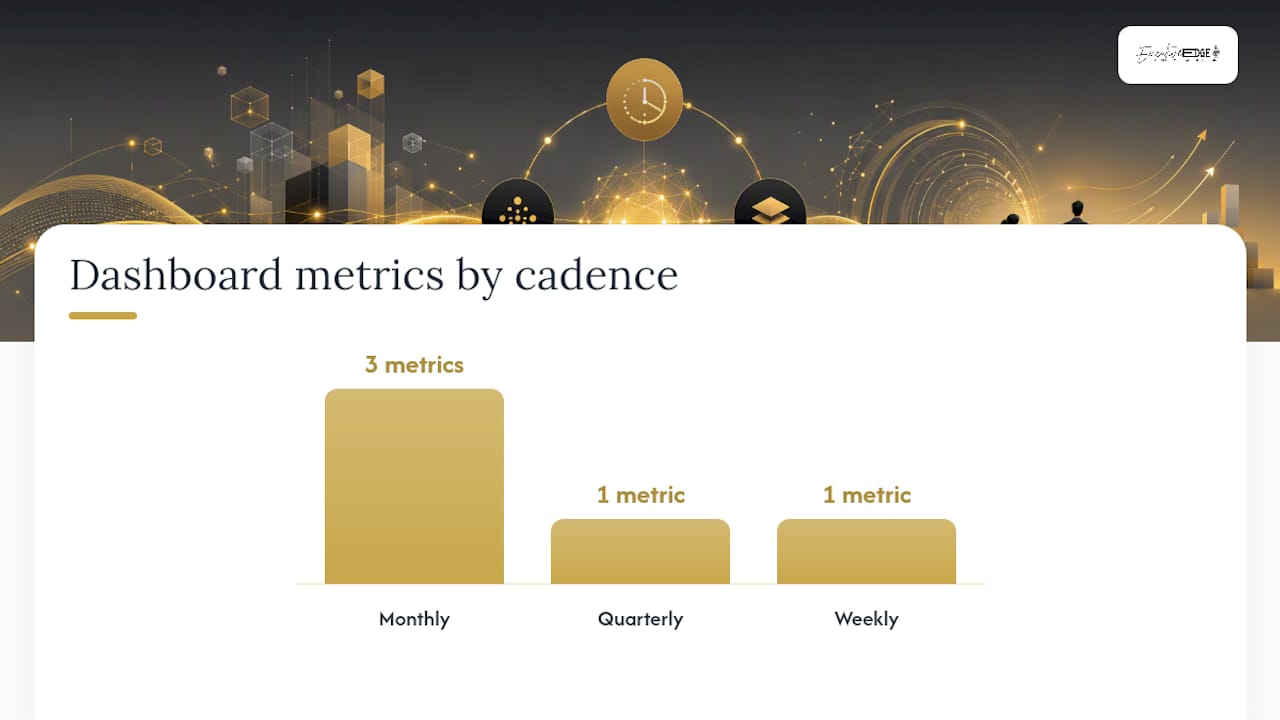
4. Build one executive dashboard, not five departmental ones. The version that actually gets read by a CFO includes:
| Dashboard component | What it answers | Recommended cadence |
|---|---|---|
| Content-attributed revenue | Which content drove closed-won deals | Monthly |
| Cost per content-attributed opportunity | Is content cheaper than paid acquisition | Monthly |
| Quarter-over-quarter pipeline growth | Is the content engine compounding | Quarterly |
| AI citation share | Are we visible in AI-driven discovery | Monthly |
| Engaged sessions by content cluster | Which topics are building an audience | Weekly |
Assign a single owner per row. The content strategist owns the weekly engagement pull, the marketing ops lead owns the monthly revenue and cost figures, and whoever presents to leadership owns turning efficiency metrics into the language finance actually responds to instead of the language analytics tools default to.
A Four-Step Sprint to Your First Content ROI Report
You don't need a year of data to produce a credible first report. You need about three weeks and a clear sequence.
- Run a five-point content audit. Pull your top 20 pages by organic traffic, then flag which ones have a visible CTA, a hidden-field UTM capture on any form, tracked scroll depth, an internal link from a high-authority page, and evidence of AI citation. Most sites fail at least three of these on most pages, and those gaps are your quick wins.
- Run a two-hour UTM and tagging sprint. Finalize the taxonomy, tag your five highest-traffic active campaigns, and confirm the GA4 events are firing correctly in the DebugView before you trust a single number.
- Connect the CRM and pull a first-touch report. Even a rough first-touch model beats no attribution model, and it's the fastest way to show a directional link between specific content and pipeline.
- Build the monthly optimization routine. Review the dashboard, flag the two weakest-performing pages by engagement drop-off, and assign one content update per week rather than a quarterly overhaul nobody has time for.
Pro Tip: Bring three slides to the CFO, not thirty. Content-attributed revenue, cost per opportunity, and one AI-citation example. That's the version that gets your budget renewed.
How Executive Edge Approaches Measurement for Real Businesses
Most business owners don't have a marketing ops team to build this stack, which is why the audit, tagging, and reporting steps above so often stall at step one. A done-for-you authority system can pair weekly content production with dashboard reporting so a business owner sees content-attributed leads and AI citation share without touching Tag Manager themselves. If your program needs a jumpstart, our guides on content velocity and content decay recovery go deeper on the production and repair side of this work. This is a pattern we see consistently with business owners in Tyler and East Texas: strong expertise, no time to build the measurement layer that proves it's paying off.
What Most Teams Get Backwards About Measurement
The conventional advice tells marketers to "prove ROI" as if it's a single number waiting to be found. It isn't. Revenue attribution on content is always a modeled estimate, and teams that chase false precision, insisting on multi-touch attribution before they've even standardized UTMs, usually end up with a dashboard nobody trusts and a report nobody reads.
The bigger mistake is treating AI citation share as a nice-to-have add-on instead of a leading indicator. A branded-search lift after an AI platform starts citing your content is often the earliest signal that authority-building is working, well before it shows up as a lead in the CRM. Most teams still can't see it because they never set up the tracking.
Start with the boring part: engaged sessions and a UTM taxonomy everyone actually uses. That foundation is what makes every tier above it trustworthy. Skip it, and the fanciest attribution model in the world is just a guess wearing a spreadsheet.
— David Domm
Get a Dashboard Built for You, Not Assembled Piece by Piece
If everything above sounds like the right approach but not something your team has three weeks to build, that's the exact gap some done-for-you authority systems exist to close. Instead of hiring a traditional agency for a strategy deck and leaving you to wire up GA4, Tag Manager, and CRM fields yourself, such services can install weekly content production, AEO and GEO optimization, and the attribution dashboard as one connected system.

The service fits local service providers, consultants, and busy marketing leaders who want content-attributed leads and AI citation share reported on a schedule, not chased down manually every quarter. Such services often include weekly podcast, blog, and short-form content production alongside CRM integration and reporting cadence, without adding headcount. If you want to see what a real report looks like before committing to anything, request a sample dashboard from Executive Edge Partner Group and compare it against whatever you're tracking today.
Sources
- The New Rules of Measuring and Proving Content ROI
- The Content ROI Playbook: How to Measure What Actually Matters in 2026
- Content Marketing Metrics: KPIs by Funnel Stage (2026 Guide)
FAQ
What Is the Four-Tier Content Measurement Framework?
It organizes metrics into consumption (traffic and impressions), engagement (CTR, return visits, CTA clicks), conversion (leads and demo requests), and revenue/authority (closed-won revenue and AI citation share).
Which Content Performance Metric Matters Most for Leadership?
Content-attributed revenue matters most to a CFO, but AI citation share is quickly becoming the earliest indicator that authority-building content is working before it shows up in pipeline numbers.
What Counts as an Engaged Session?
GA4's default counts a session as engaged after 10 seconds, a conversion event, or two pageviews, though tying engagement to scroll depth or a meaningful action gives a more reliable signal for long-form content.
Should I Start With First-Touch or Multi-Touch Attribution?
Start with first-touch attribution because it can be set up in a few hours and gives directionally accurate results; move to multi-touch or position-based models once lead volume supports the added complexity.
How Do I Track AI Citation Share?
Manually check target queries across ChatGPT, Perplexity, and Google AI Overviews for citations of your domain, then track branded-search volume over time as a secondary signal; done-for-you systems like Executive Edge Partner Group build this into a recurring dashboard.
How Long Until I Can Report Content-Attributed Revenue?
Most teams can produce a first-touch attribution report within a few weeks of proper UTM tagging and CRM integration, though a reliable revenue-attribution model typically takes six to twelve months of consistent data.