

Track six numbers before anything else: unique listeners, IAB-qualified downloads, consumption rate, follower growth, returning listeners, and impressions-to-follow conversion. Each answers a different question: reach, delivery, engagement, loyalty, retention, and discovery. Report every single one with three labels attached, source, definition, and time window, because "Downloads (Host, 30d)" and "Consumption (Apple, 7d)" tell you completely different stories, and mixing them without labels is how shows end up chasing the wrong problem for months.
That labeling habit matters more than any individual metric. Here's the shortlist and what each one is actually for:
- Unique listeners — reach, the real number of distinct people hitting play
- Downloads (IAB-qualified) — delivery, what you report to sponsors
- Consumption/completion rate — engagement, whether people stick around
- Followers/subscribers — loyalty, whether one listen becomes a habit
- Returning listeners — retention, the closest thing to a health score your show has
- Impressions and discovery conversion — how browsers become listeners
Everything else in podcast analytics metrics is either a variant of these six or a vanity number dressed up to look important.
Table of Contents
- Podcast Analytics Metrics That Matter Most: A Field Guide
- Why You Can't Add Apple, Spotify, and Host Numbers Together
- Building a One-Page Scorecard Your Team Will Actually Use
- Reading the Patterns: What Metric Movement Actually Tells You
- Getting Measurement Hygiene Right Before You Trust Any Number
- How Executive Edge Applies These KPIs for Business Podcasts
- What Listener Engagement Actually Looks Like in the Data
- Tracing Where Your Listeners Actually Come From
- Turning Downloads Into Revenue: Monetization Metrics That Matter
- Producer's Note: Treating Metrics as Instruments, Not Grades
- A Done-For-You Path When You'd Rather Not Build the Scorecard Yourself
- Sources
- FAQ
Podcast Analytics Metrics That Matter Most: A Field Guide
Most podcast dashboards throw thirty numbers at you and call it insight. It isn't. A handful of podcast performance metrics carry almost all the diagnostic weight, and knowing what each one measures, and where it lies to you, separates shows that grow from shows that just accumulate downloads.
Unique listeners estimate the actual number of distinct humans who played an episode, usually derived from IP address and user agent combinations rather than a hard login count. Platforms approximate this because podcasts, unlike streaming video, rarely require authentication. Prefer this metric over raw downloads when you're answering "how big is my audience," because downloads count file requests, including a listener who downloaded the same episode on two devices.
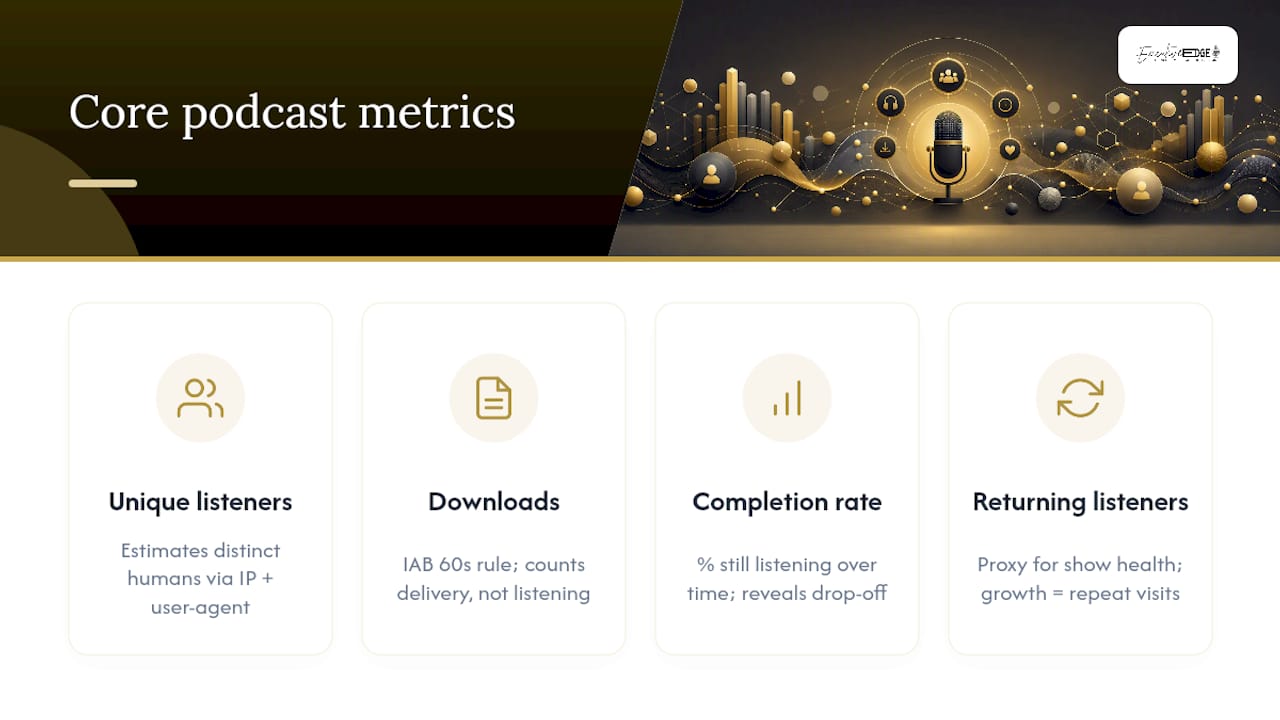
Downloads, the IAB-qualified kind, follow a specific technical definition. The IAB Tech Lab counts a download as a file request meeting a roughly 60-second threshold, with deduplication rules that filter out incomplete buffering and bot traffic. Hosts rely on this standard because it's the figure sponsors expect on an insertion order. It measures delivery, not listening. A file can download fully to a phone that never leaves a pocket.
Plays and streams are platform-specific counting events, and thresholds vary. A "stream" on one platform might require 30 seconds of playback, while another counts any tap of the play button. Treat these as directional signals within a single platform, never as a number you compare across platforms.
Consumption and completion rate reveal what downloads can't: whether people actually listened. A drop-off curve, plotting the percentage of the audience still listening at each minute, tells you exactly where attention dies. If half your audience bails at the 90-second mark, that's not a content problem three episodes from now, that's your intro, today.
Followers and subscribers convert casual listeners into a recurring audience. Benchmark growth against your own median, not an industry number pulled from a listicle, because follower conversion rates swing wildly by genre and episode length.
Returning listeners may be the single best proxy for show health. New downloads can spike from a single viral clip; returning listeners only grow when the content itself earns a second visit. Podstatus recommends reading this alongside completion rate for the clearest picture of whether a show is actually building an audience or just generating noise.
Impressions and discovery conversion measure the top of the funnel: how many people saw your show in a feed or search result, and how many of those converted to a play or follow. This is where promotional spend either earns its keep or doesn't.
Chart position and reviews get outsized attention because they're visible and emotionally satisfying. A top-10 category ranking signals momentum for roughly 24 to 48 hours. It says nothing about consumption, nothing about retention, and nothing about revenue. Treat chart movement as a marketing signal to investigate, not a KPI to optimize for directly.
Why You Can't Add Apple, Spotify, and Host Numbers Together
Every platform counts differently, and stacking their totals into one "audience size" number produces a figure that means nothing.
- Apple Podcasts distinguishes a play from an "engaged listener," generally someone who streams at least 20 minutes or 40% of an episode, whichever comes first, and its consumption reports break listening into time-based bands.
- Spotify applies its own stream threshold, commonly around 30 seconds of playback, and segments discovery separately from returning-listener plays.
- Host totals are the aggregate baseline, built from server logs across every app that pulls your RSS feed, which is why your host dashboard almost always shows a bigger number than any single platform.
- YouTube measures an entirely different population using views and average view duration, metrics built for video behavior, not audio habits.
The fix is simple: pick one primary metric for cross-channel reporting, and label which platform and window produced it every time you cite it.
Building a One-Page Scorecard Your Team Will Actually Use
A scorecard only works if it fits on one screen. Cramming in every available metric guarantees nobody checks it past week two.
- Unique listeners (reach)
- Median 30-day downloads, calculated across your last 8 to 12 episodes, not the mean, since one viral episode skews an average and Podder's guidance on median baselines holds up well for sponsor conversations
- Average consumption rate
- New followers for the period
- Returning listeners
- Chart position and review themes, tracked qualitatively
Each row should record five fields: value, source, definition, window, and percent change versus the prior period.
Reproduce that layout in any spreadsheet. The structure matters more than the tool.
Reading the Patterns: What Metric Movement Actually Tells You
Numbers moving in different directions almost always mean something specific. Here's how to diagnose the four patterns you'll see most often:
- Downloads up, consumption down. This usually signals a promotional leak, meaning paid or cross-promoted traffic is arriving but not sticking. Test your intro and episode structure before spending more on distribution.
- Consumption up, downloads flat. Content is resonating with the audience you already have. This is the moment to invest in discovery, not retention fixes.
- Low follower conversion. The content is working, but the show page, trailer, or in-episode call to action isn't converting listeners into subscribers. Test a direct CTA at the episode's midpoint.
- A consistent drop at the same timestamp across episodes. That's not audience fatigue, that's a structural issue, usually a segment, ad read, or transition that needs editing.
Always compare against your own median, not an industry benchmark, and keep the reporting window fixed between comparisons.
Pro Tip: If downloads jump but average consumption drops in the same 30-day window, treat the growth as unproven until a retention experiment confirms real audience gains, Podstatus calls this pattern "false growth," and it's one of the most common false signals in podcast reporting.
Getting Measurement Hygiene Right Before You Trust Any Number
Reliable numbers start with a clean setup, not a better dashboard.
- Confirm your host is IAB-certified, or install a measurement prefix, if you need a delivery figure that will hold up in a sponsor negotiation.
- Fix a reporting window, 30 days as the standard, 7 days for a launch, and never switch windows mid-comparison.
- Label every reported number with its source and definition, a practice the IAB's v2.2 guidelines treat as foundational to defensible reporting.
- Use tagged links for any campaign-driven promotion so discovery conversion is traceable back to the channel that produced it.
- Set a cadence: a weekly pulse check, a monthly full review, and a quarterly strategy realignment.
How Executive Edge Applies These KPIs for Business Podcasts
A done-for-you authority engine only earns its keep if the numbers tie back to business outcomes, not just audience vanity metrics. Executive Edge Partner Group maps the same scorecard above to things a business owner actually cares about: CRM-attributed leads, branded search lift, and direct booking requests traced to a specific episode.
- Weekly scorecard delivery using the source-and-window labeling discipline outlined above
- Episode-level retention notes flagging exactly where a drop-off curve breaks
- Promotional channel tagging so a LinkedIn clip and a paid audio ad are never lumped into one undifferentiated "downloads" number
The gap between a podcast that builds authority and one that just makes noise almost never comes down to production quality. It comes down to whether anyone is reading the retention curve and acting on it before the next episode records.
This mirrors the KPI-to-outcome mapping described in how podcast marketing works within a broader content system, where measurement isn't a report that gets filed, it's an input into the next production decision.
What Listener Engagement Actually Looks Like in the Data
Downloads and consumption tell you whether people are listening. Engagement metrics tell you whether they care enough to act. That distinction shows up in a handful of concrete signals most dashboards bury several tabs deep.
Ratings and written reviews are the most visible engagement signal, but volume matters less than theme. A show with 40 reviews that repeatedly mention a specific segment or guest type is handing you a content roadmap for free. Read them monthly and tag recurring phrases rather than just watching the star average tick up or down.
Social shares and clip performance function as a proxy for emotional resonance. When a 90-second clip from episode 47 outperforms your average post by three or four times, that's a signal about which moments in the full episode deserve more airtime, not just a marketing win.

Direct listener replies, voicemail features, email responses to a call-to-action, or comments on a video version, are the highest-intent engagement signal available, because they require more effort than a passive download. A show generating even a handful of unsolicited listener emails per episode has a stickier audience than one with triple the downloads and zero replies.
Community activity, a Discord server, a Facebook group, a subreddit tied to the show, extends engagement past the episode itself. It's harder to measure cleanly, but active member counts and post frequency both correlate with the kind of loyal audience that returning-listener data alone can undercount.
Tracing Where Your Listeners Actually Come From
Downloads without attribution are a number with no story attached. Attribution and source tracking close that gap by connecting a listen back to the channel, campaign, or referral that produced it.
Tagged tracking links are the simplest tool available. Any time you promote an episode, on social, in an email newsletter, through a paid placement, run it through a unique tracking link rather than the raw show URL. That single habit turns "impressions and discovery conversion" from an abstract funnel concept into a measurable one, since you can see exactly how many clicks from a specific LinkedIn post converted into a play.
UTM parameters extend the same logic to your website and landing pages, letting you see whether a podcast mention on a guest's blog is actually sending listeners your way or just generating vanity traffic.
Referral data inside your host dashboard captures a different layer: which apps, Apple Podcasts, Spotify, Overcast, are sending the discovery traffic, separate from which marketing channel drove the original click. Cross-reference both, and you get a real picture of the impressions-to-conversion funnel, since ad frequency and placement consistency both influence how many of those impressions ever convert to a play.
Guest-driven traffic deserves its own tag. If a guest promotes the episode to their own audience, that traffic behaves differently than organic search or platform discovery, usually higher completion rates, lower long-term retention, since it's often a one-time audience rather than habitual show followers.
Turning Downloads Into Revenue: Monetization Metrics That Matter
Audience metrics are the input. Revenue metrics are the proof that the audience translates into something a business can measure against cost.
CPM (cost per mille) is the standard sponsorship pricing unit, calculated as the ad rate divided by downloads per thousand. Rates vary enormously by niche, audience demographic, and ad placement (pre-roll, mid-roll, or post-roll commands different rates, with mid-roll typically pricing highest because listener attention is most established by that point). There's no single "good" CPM figure that applies universally. What matters more than chasing an industry number is tracking your own CPM trend over time and against your own download baseline, since a rising CPM on flat downloads usually means your audience quality or niche specificity is improving.
Ad performance tracking requires the same source-and-window discipline as every other metric here. A promo code redemption rate tells you a completely different thing than a trackable link click rate, and both differ from simple impressions delivered. Report all three separately rather than collapsing them into one vague "ad performance" number.
Direct monetization streams, premium subscriptions, listener donations, merchandise, live event ticket sales, deserve their own line items rather than getting folded into overall revenue. A show earning steady subscription revenue from a small, loyal base has a fundamentally different growth trajectory than one relying entirely on sponsorship CPMs, even if total revenue looks similar on a spreadsheet.
Attribution to business outcomes matters most for branded and business podcasts, where the real return isn't ad revenue at all, it's leads, consultations booked, or measurable brand search lift tied back to episode release dates.
Producer's Note: Treating Metrics as Instruments, Not Grades
If you run a lean team, track four numbers well instead of twelve numbers badly: unique listeners, median downloads, consumption, and returning listeners. Median beats average every time you're comparing episodes, because one lucky release shouldn't set your baseline. We see this constantly with East Texas business owners launching branded podcasts: the temptation is to chase chart rank, when the number that actually predicts whether the show still exists in a year is retention.
— David Domm
A Done-For-You Path When You'd Rather Not Build the Scorecard Yourself
Building and maintaining the scorecard above, correctly labeled, updated weekly, tied to actual business outcomes, is a real job, and most business owners already have one. Executive Edge Partner Group runs this as a managed system: weekly podcast production, consistent measurement using the same source-and-window discipline outlined here, and reporting that connects episode performance to CRM-attributed leads and branded search lift rather than just download counts.

The service pairs production with distribution across podcast platforms, YouTube, and short-form social clips, so the attribution tracking described above happens automatically instead of getting rebuilt from scratch every month. For business owners and professionals in Tyler and East Texas who want authority content without adding a measurement job to their plate, visit Executive Edge Partner Group to see a sample scorecard or set up a discovery call to walk through how the system maps to your specific goals.
Key Standards and Practitioner Resources to Consult
For primary technical standards, see the IAB Podcast Measurement v2.2 guidelines and the v2.3 public comment draft. Practitioner frameworks worth bookmarking include Podstatus's metrics guide and Podder's analytics breakdown.
Sources
- Podcast Analytics: The Metrics That Actually Help You Grow | Podstatus
- Podcast Measurement v2.2 — IAB Tech Lab (PDF)
- Podcast analytics: the metrics that actually matter | Podder
FAQ
What Are Good Metrics for a Podcast?
Unique listeners, IAB-qualified downloads, consumption rate, follower growth, and returning listeners cover reach, delivery, engagement, loyalty, and retention, the five questions every show needs answered.
How Much Does a Podcast With 50,000 Listeners Make?
Revenue depends heavily on CPM rates, niche, and ad placement, so there's no fixed figure. Track your own CPM against your download baseline rather than relying on an industry average.
How Do I Check My Podcast Analytics?
Start with your hosting platform's dashboard for download and consumption data, then cross-reference Apple Podcasts Connect and Spotify for Podcasters for platform-specific engaged-listener and stream metrics.
What Is a Good CPM for Podcasts?
CPM varies too widely by niche, audience, and ad placement to name a universal "good" figure. Mid-roll ads typically command higher CPMs than pre-roll or post-roll placements because listener attention is more established by that point.